Jana Buchtova
Background
SkogApp
SkogApp is an accessible forestry management platform, which uses AI to provides essential tools for tracking forest health, CO2 capturing, timber volume/prices, and future Bio-Growth, empowering foresters to make informed decisions and manage their forests more efficiently.
In collaboration with forestry experts, government agencies, and academic institutions, SkogApp has proven to decrease costs, increase productivity and be effective in protecting the environment and biodiversity.
Project Timeline
17.06.2024- 09.08.2024
.png)


My role
I designed the user experience and interface of the SkogApp web application, leading the redesign to make it more intuitive and accessible for older forest owners.
I was responsible for:
-
Developing user surveys and personas
-
Conducting competitor analysis
-
Creating personas
-
Building a comprehensive design system
-
Mapping user flows and information architecture
-
Prototyping
-
Leading workshops on design thinking and wireframing
-
Requirements management and reporting to C-Level executives
-
Designed the UI components
Problem statement
Older forest owners, mostly over 50, struggle with current forestry apps that are too complex and hard to navigate. Small text, cluttered layouts, and lack of clear guidance make key tasks like updating forestry plans, checking timber prices, and using maps frustrating. SkogApp aims to fix this by creating a simple, user-friendly solution tailored to their needs, making forest management easier and more accessible.
The Goal
This project aimed to redesign the SkogApp platform to create an intuitive and accessible experience for forest owners. SkogApp wanted to address users' challenges with existing forestry management apps, such as complex interfaces, slow data retrieval, and limited accessibility features. By simplifying navigation, enhancing accessibility, and providing faster data updates, the new design aimed to empower forest owners to manage their forests more efficiently and with greater ease.
Empathy Map
What do they say?
-
"I’ve owned a forest for over 10 years."
-
"I use my laptop or smartphone the most."
-
"I don’t want a summary of my forest."
-
"I need help clearing debris and getting a decent price for wood."
-
"The app I use is hard to navigate and displays unnecessary heavy data."
What do they do?
-
Use the app to measure costs, plan forest management, and track stock.
-
Engage in forest care and try to keep the forestry plan updated.
-
Face challenges in managing forest debris and keeping an overview of management tasks.
-
Struggle with getting the correct data registered in one place.
-
Deal with logging, planning measures, and checking how many trees per acre exist.
-
Use GIS and mapping features but find the interface insufficient for multi-age forestry.
Who are we empathizing with?
We are empathizing with foresters, primarily men over the age of 50, who come from diverse educational and professional backgrounds.
What do they think?
-
"There should be an option for multiple users, since managing a forest can involve more than one person."
-
"I’m uncertain about whom to contact for help with specific forest management tasks."
-
"I need better tools for location data registration and mapping."
-
"It’s important to keep my forestry plan up-to-date, but it’s difficult to manage."
-
"I wish there were more accurate map features."
What do they feel?
-
Frustrated when the app is slow or expensive.
-
Anxious about not being able to handle political conditions.
-
Overwhelmed by managing large forest areas, particularly in snow-heavy regions.
-
Concerned about staying up-to-date with forestry regulations and planning.
-
Appreciates the accuracy of the app’s information but feels limited by its incomplete feature set.
-
Feels a lack of confidence due to the app’s limitations in terms of map layers and data registration.
"I'm not tech-savvy and feel silly when using complicated apps."
"The application I'm using now is very complicated."
"The offline function doesn’t always work."
"There’s too much heavy data that I don’t need, and I don’t even know what it’s for."

Design Toolkit
Figma, FigJam, Google Sheet, Airtable
Design Process
I used a 5-stages Design Thinking model.
1. Empathise, 2. Define, 3. Ideate, 4. Prototype, 5. Test
Competitor's analysis
I analyzed two of the largest competitors in the forestry management app space to better understand their strengths and areas for improvement.
Strengths
-
Users can access essential features without an internet connection, making the apps useful in remote locations.
-
Educational resources: One competitor excels by offering detailed guides and educational tools that help users understand forestry management.
-
Strategic forest management: Tools and guides for managing forests strategically, helping users plan tasks more effectively.
-
One app provides detailed reports for stock management and health.
-
Both platforms offer map layers, enabling users to visualize their land and data, though improvements are still needed.
Weaknesses
-
Both apps overwhelm users with too much data and poor navigation.
-
Offline functionality exists, performance slows down considerably when not connected to the internet.
-
Missing map features: Key functions such as detailed route planning or multi-age forest management.
-
Inflexible data input: Lack of support for free text registration.
-
Lack of menus for managing map layers .
-
Information about technical support is hard to find.
-
The onboarding process is difficult, with little guidance to help users get started.
-
No financial and bio-growth model
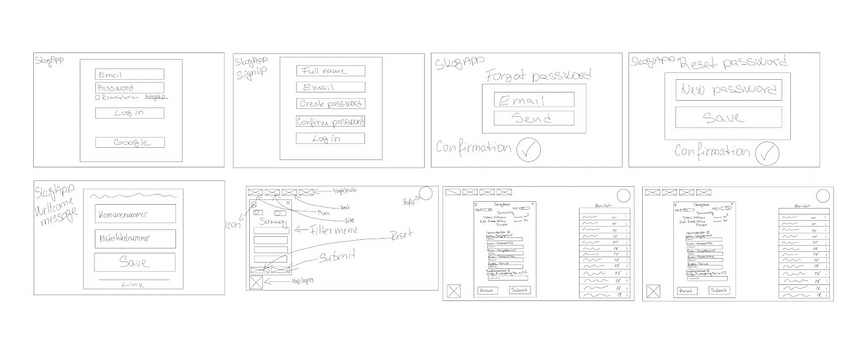
First SkogApp Sketches
These are the very first sketches for the basic user flow:
-
Sign-in: Simple email/password fields or Google login.
-
Sign-up: Easy steps for adding name, email, and password or with Google login.
-
Password Reset: Quick process to reset and confirm passwords.
-
Find Forest Input: Clear input for your forest IDs.
-
Data Tables: Different layouts to easily view and manage forest data.
Userflow
This flow showcases how a forest owner can easily navigate SkogApp, from signing up to managing their forest data and timber prices. The goal was to create a seamless and user-friendly experience that guides users through key features while offering them the flexibility to explore at their own pace.

Look & Feel
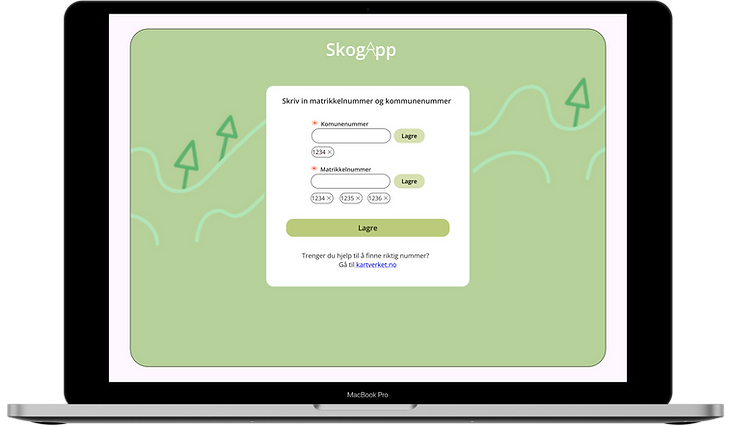
Kommune and Matrikkel Number Page
Each property in Norway has a unique komunenummer+matrikkelnummer. Users are required to enter their komunenummer and matrikkelnummer before proceeding to the landing page. These numbers are automatically saved, but can be updated at any time. A link is available to assist with finding the property unique numbers if needed.

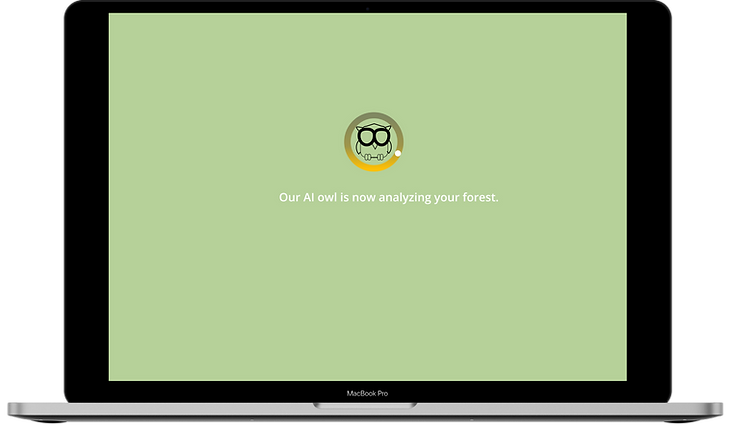
Forest Overview Screen
After the AI analysis is done, users land on this page. Here, they can view different types of data about their forest and access essential forest management tools. The mobile version offers the same features, optimized for easy navigation on smaller screens.
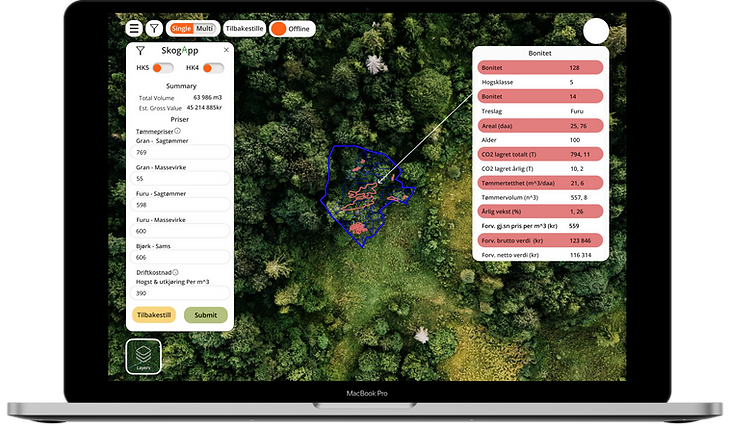
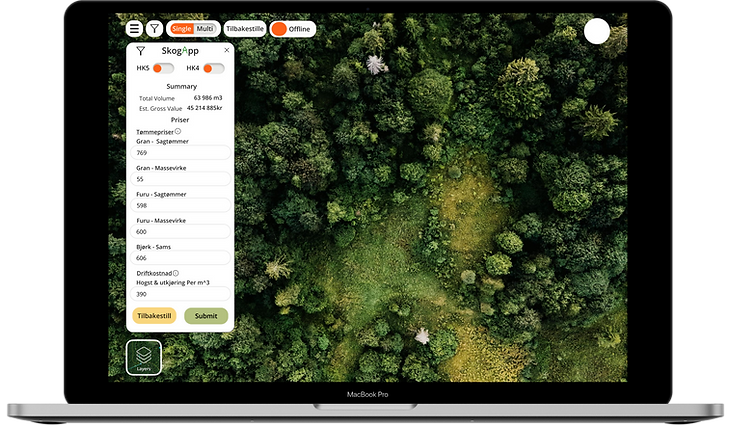
Filter and Calculator
This screen allows users to filter and calculate timber prices based on their own inputs. Users can add their numbers, and SkogApp provides a clear breakdown of costs. Based on the entered numbers, the forest financial models updates in real-time and use can see the new calculated values by clicking on the desired polygon.
HK4/5 Selected
Here, users have pre-defined filters, like HK5, which will show all the polygons with the maturity level 4/5 that are ready to be cut. The sidebar shows key insights to help with decision-making.

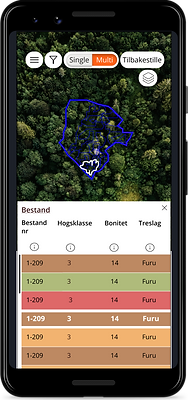
Multi select page
SkogApp provides data displayed in color-coded tables (the colors are coded based on the level of maturity of the selected polygons. This is helpful because users are familiar with the colors, and they can see the maturity level only by seeing the color rather of having to read the text). In this menu, foresters can see multiple selected polygons and compare their characteristics against each other to make a better informed decision and create a strategy on where to deforest/reforest.

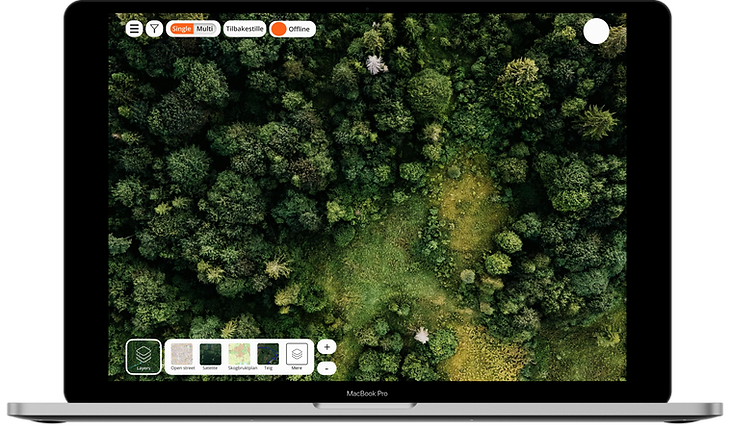
Topographic Layers Panel
This screen allows users to toggle between different map layers, offering various views of their forest.
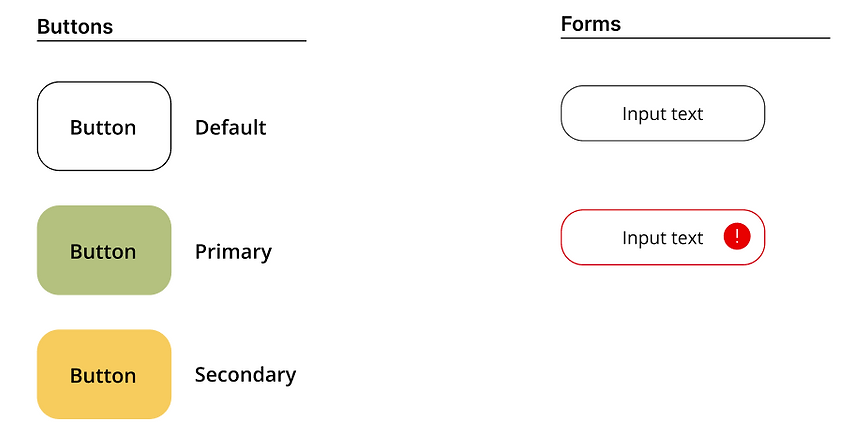
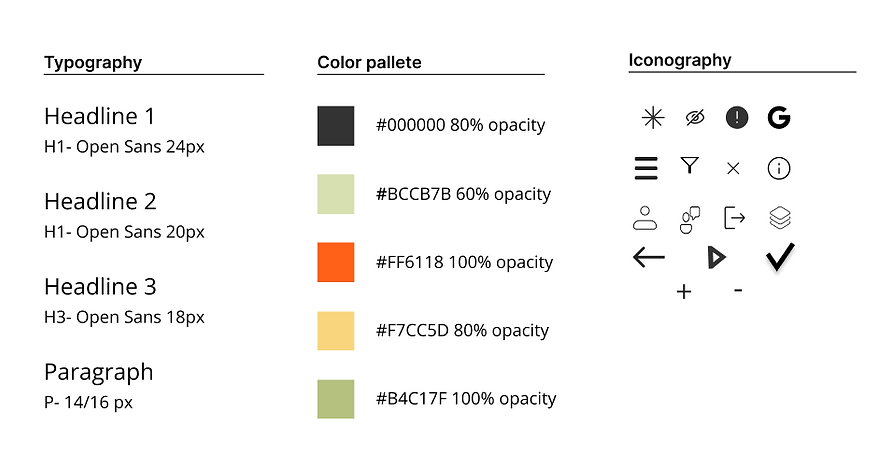
Design system
We developed a design system to bring consistency and clarity to the SkogApp interface. The new color palette complements the existing colors used in the data tables, enhancing readability and accessibility throughout the app. We chose simple, readable fonts for headlines and paragraphs to ensure legibility on all screen sizes. The icons are intuitive and functional, designed to guide users through the app with ease.
Spacing System